GEOG 4400/5960 - Introduction to Remote Sensing
Supplementary to Lab #5
Image Annotation and Map Composition
Objectives
- To understand how to create annotation layers
- To create a map composition using ERDAS Imagine's Map Composer
Part I Image Annotation
Before you begin this section first select the IMAGINE Online
Documentation option under the Session dropdown menu selection
Help. Click on the Manuals button. From this menu you can access
the majority of the on-line help manuals. Take a brief look at the
Annotation option to get familiar with image annotation. Begin by
displaying an image in the viewer. In the File dropdown menu in the
viewer select New - Annotation Layer... In the window that opens give
the name exercise4.ovr (.ovr is for annotation layers) for the
annotation layer file and press OK.
The Annotation Tool menu will appear. Click on the Create Text
Annotation button in the menu  Now move your cursor in the viewer where
you want to place text. Single click and a window will appear for you to enter
a text string. When you are done entering text, click OK. Now select
the text by clicking it. A double click with the mouse will bring up the
Text Properties window. You can move the text by selecting it (lmb) and
sliding it around while holding the lmb down. A box will appear around the
text string and you can also alter the size by selecting the box and
manipulating it...experiment. If you want to make any changes in font style,
color etc., make them while the text is selected and apply them. To de-select
text, select an area on screen away from the text. You can change the text
style by clicking on the Display Annotation Styles button
  When the Styles window
appears, open the Text Styles menu with the rmb and choose Others...
The Custom folder will give you several options to choose from including
fill color, font style, and size. Use this tool to make your choices about the
text you will place in the annotation layer. You have the ability to change
the text selections, etc. at a later point as well if you are not satisfied
with these original choices.
Annotation for images should contain certain entries so that others can
tell what has been altered in the image that may be important to how they use
it to make decisions. The following items are good to include on an
annotation: 1) Your name 2) The sensor system (SPOT, TM, CAMS etc.) 3) Any
alterations listed that were done to the image (rectified, filtered etc.) 4)
The band assignments to their display colors (R,G,B = 1,2,3 etc.) 5) The date
you completed the work on the image (You should display the date as follows:
10 August 1997). This information should also NOT be put on top of the image
but off to the side or below it. This is because you would not want the
annotation covering up vital parts of the image so that they could not be
viewed.
When you are finished save the image and its annotation file by selecting
Save under the viewer menu File.
Part II Map Composer
Image (for the trial only)
| File Name |
Denton_spot920721.img |
Altitude
|
| Location |
Denton, Texas |
832 km |
| Sensor |
SPOT XS |
| Spatial |
20 m x 20 m |
| Spectral |
Band 1 = Green (.50-.59)
Band 2 = Red (.61-.68)
Band 3 = NIR (.79-.89) |
The ERDAS Imagine Map Composer is a WYSIWYG (What You See Is What You Get)
editor for creating cartographic-quality maps and presentation graphics. Maps
can include single or multiple continuous raster layers, thematic (GIS)
layers, vector layers, and annotation layers. First, copy the
modeler_output.img image into your /Geog/751f00 directory. To start the
map composition process, select the Composer button from the Imagine
icon panel.

In the menu that appears, select New Map Composition. You can also
create a new composition by selecting File - New - Composition from the
Imagine viewer menu bar. When the New Map Composition dialog opens, enter the
name exercise4-a.map as the new map name. Specify a Map Width of 7.5
and a Map Height of 10 (to allow for a small margin on the 8.5x11
map). Make sure the Units is set to inches and then click OK.
A blank Map Composer viewer will display along with the Annotation tool
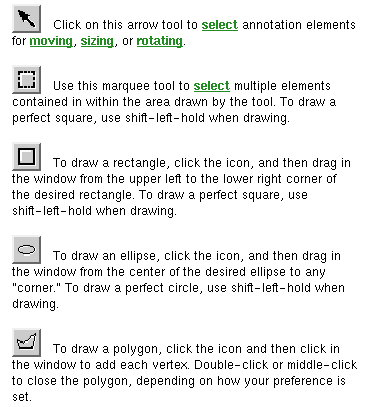
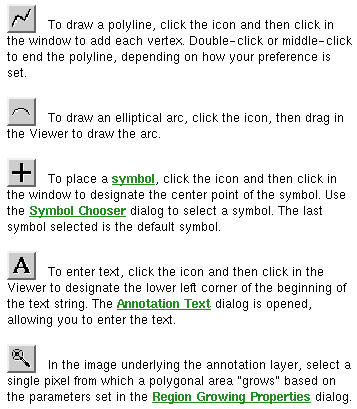
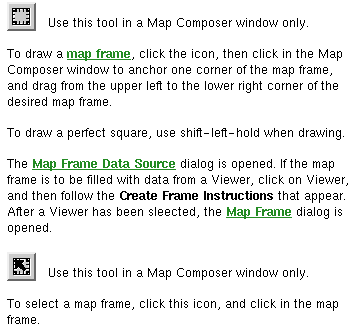
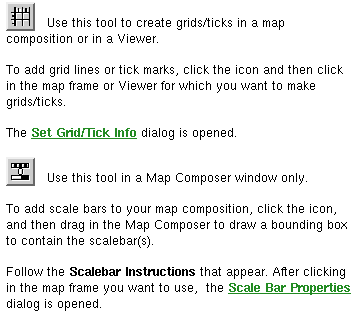
palette. The functions of each of the major icons in the Annotation tool
palette are described below:
With your cursor in the Map Composer viewer, right-hold Fit Map To
Window from the QuickView menu, so that you can see the entire map
composition page. Now in the Imagine viewer, open the model_output.img
file and select Fit to Frame before opening. Once this image is
opened, you must now define your map frame (where you want your image to
appear on your composition). Click on the Map Frame icon to draw the
boundary of the map frame. Near the top of the Map Composer viewer, shift-drag
your cursor downward at an angle to draw the map frame. You can position the
size of the map frame later. Make sure you allow ample space for a title,
legend, north arrow, and scale bar. When you release the mouse button, the
Map Frame Data Source dialog should appear. Click on Viewer...
and then click anywhere in the viewer displaying the modeler_output.img
image.
Draw the Map Frame
The Map Frame dialog should open, giving
you options for sizing, scaling, and positioning the new map frame. A cursor
box also displays in the viewer. This cursor box allows you to select the area
you want to use in the map composition. You can move the map frame in the Map
Composer window and the cursor box in the viewer by dragging and resizing them
with the mouse, or you can move one or both boxes by manipulating the
information in the Map Frame dialog. You can also rotate the box in the viewer
if you want to change the orientation. In the Map Frame dialog, click
Change Map and Frame Area (Maintain Scale) so that you can accurately
size the map frame. Now enter the value of 5.5 in both the Frame Width
and the Frame Height fields. Now click on Change Scale and Map
Area (Maintain Frame Area) and enter the Upper Left Frame Coordinates X
value of 1.0 and a Y value of 9.0. Set the Scale
to 50,000. Now position the cursor box in the viewer to the area
you want to display in the map composition, and click OK.
You may edit the map frame by clicking on the Select Map Frame icon
in the Annotation tool palette. When this tool is selected, you can select any
map frame within the composition for resizing or repositioning purposes. If
you make a mistake during this long process, you can delete a map frame by
going to View - Arrange Layers... in the Map Composer viewer menu bar.
When the Arrange Layers dialog appears, position your cursor above the map
frame you want to delete and hold down the right mouse button. Select
Delete Layers from the Frame Options popup list, then click Apply.
Add a Neatline and Tick Marks
Next we will add a neatline and some
tick marks to our composition. A neatline is a rectangular border
around a map frame. Tick marks are small lines along the edge of the
map frame that indicate the map units (meters, feet, etc.). You must be using
a georeferenced image in order to produce tick marks. Now go to the Annotation
tools palette and select the Grid/Tick icon and click on the map frame
on which you want to place the neatline and tick marks. When the Set
Grid/Tick Info dialog appears enter the following parameters:
Horizontal Axis (Length Inside) = 0.06
Spacing = 5000
Click
on Copy to Vertical (to copy to vertical axis)
Click Apply
If
you are satisified with the appearance of the neatline, click Close in
the Set Grid/Tick Info dialog, otherwise click Undo Previous Edits
button in the tools menu to make adjustments.
Change Text/Line Styles
The text and line styles used for neatlines,
tick marks, and grid lines depend on the default settings in the Styles
dialog. You can either set the styles before adding annotation or change the
style once they are placed on the map. In your map, you will set the line
style to 1 point for the neatline and tick marks, and the text size to 10
points for the tick labels. Do this by clicking on the labels outside the map
frame. From the Map Composer viewer menu bar, select Annotation - Styles...
Set the text and line styles using the same methods explained in Part I.
Annotation may be grouped and ungrouped by selecting Annotation - Group
or Ungroup.
Make a Scale Bar
As with adding tick marks, in order to create a
scale bar you must be using an image that is georeferenced (rectified). Select
the Scale Bar Tool icon from the Annotation tool palette. Move the
cursor into the Map Composer viewer and the cursor changes to the scale bar
positioning cursor. Drag the mouse to draw a box under the right corner of the
map frame, outlining the length and location of the scale bar. You can change
the size and location later if needed. Follow the directions by clicking in
the map frame to indicate that this is the image whose scale you are showing.
In the Scale Bar Properties dialog, select Kilometers and
Miles as the Units and set the Maximum Length to 2.0
Inches. Click Apply. You may redo the scale bar if you are
dissatisfied with the results. You may reposition the scale bar by clicking on
the center point and dragging it to the desired position.
Create a Legend
In order to create a legend, you must have a file
opened that contains thematic data. Click on the Legend icon in the
Annotation tool palette. Move the cursor into the Map Composer window and
click under the left side of the map frame to indicate the position of the
upper left corner of the legend. Click in the map frame to indicate that this
is the image you want to use to create the legend. When the Legend
Properties dialog appears, the Basic properties should be
displayed. The Class Names are listed under Legend Layout. Under
Legend Layout rename the Class_5 by highlighting it and typing
SPOT Panchromatic. Now select rows 2 through 6 to select the classes to
be displayed in the legend. Now click on the Title tab at the top of
the dialog and left justify the Title Alignment. Click Apply. Like all
other graphics, you may reposition the legend by selecting it and dragging
with the mouse.
Add a Map Title
Click on the Text icon in the Annotation tool
palette. Move the cursor to the top of the map and click where you want to
place text. When the Annotation Text dialog appears, enter the
following title: Environmental Sensitivity Analysis and click OK.
Change the text style by selecting Annotation - Styles in the Map
Composer menu bar and setting the following parameters:
Size: 20 points
Font Name: Antique-Olive (Under the Custom
folder)
Position the title by double-clicking on the text and
entering the following parameters in the Text Properties dialog:
X: 3.75
Y: 9.5
Vertical Alignment: Bottom
Horizontal
Alignment: Center
Place a North Arrow
Map Composer contains many symbols, including
north arrows. These symbols are pre-drawn groups of elements that are stored
in a library. If the Styles dialog isn't opened, select Annotation -
Styles... from the Map Composer menu bar. In the Styles dialog, hold down
the popup list next to Symbol Style: and select Other... In the
Symbol Chooser dialog, select North Arrows in the menu popup list.
Select north arrow 4 from the list. Change the size to 36 points
and click Apply. Close the Symbol Chooser dialog and select the
Symbol tool from the Annotation tool palette (looks like a crosshair).
In the Map Composer viewer, click under the map image, between the legend and
the scale bars. Once the north arrow is displayed, you can reposition all
graphics so they appear neat and orderly on the composition. Remember you can
double-click on most graphics to bring up a Properties dialog for editing
purposes.
Write Descriptive Text
Include on your map composition the following
descriptive text using the following properties:
Denton, Texas
SPOT XS Multispectral Image
Size: 10 points
Text Font: Antique-Olive
Fill Style: Soild Black
When grading the map composer print-out, I will be looking for
all of the above items with their associated correct properties and organized
placement. When you feel you have met each of these criteria in your map
composition be sure to Save the map composition in your your home directory
and print a hardcopy using the HP color printer in the back of the lab.
Part III Create your own Map
Now use your creative abilities to create a second map using an image of your choice
acquired elsewhere. You may want to display and compare different bands,
density slice an image, or display contrast enhancements...the choice is
yours. Be sure to include a title, scale bar, legend, north arrow, descriptive
text, and other map essentials that are appropriate for your image. Save the
map composition in your home directory when finished. Now move your cursor in the viewer where
you want to place text. Single click and a window will appear for you to enter
a text string. When you are done entering text, click OK. Now select
the text by clicking it. A double click with the mouse will bring up the
Text Properties window. You can move the text by selecting it (lmb) and
sliding it around while holding the lmb down. A box will appear around the
text string and you can also alter the size by selecting the box and
manipulating it...experiment. If you want to make any changes in font style,
color etc., make them while the text is selected and apply them. To de-select
text, select an area on screen away from the text. You can change the text
style by clicking on the Display Annotation Styles button
  When the Styles window
appears, open the Text Styles menu with the rmb and choose Others...
The Custom folder will give you several options to choose from including
fill color, font style, and size. Use this tool to make your choices about the
text you will place in the annotation layer. You have the ability to change
the text selections, etc. at a later point as well if you are not satisfied
with these original choices.

